The Boonie Conundrum
Monte Carlo Simulation of a Conspiracy
Ask NotebookLMThe Mathematics of Conspiracy Theories
Understanding conspiracy theories mathematically provides a way to evaluate their plausibility. Rather than relying solely on subjective assessments, mathematical models allow us to examine factors like complexity, the number of people involved, and the duration of secrecy required.
One approach, introduced by physicist David Robert Grimes, quantifies the likelihood of a conspiracy remaining secret over time. According to Grimes, a conspiracy’s viability decreases rapidly as the number of participants grows and as time passes. This is because each participant presents an additional risk factor, capable of intentionally or unintentionally revealing the conspiracy.
For instance, a conspiracy theory involving a vast, coordinated effort among thousands of individuals maintaining absolute secrecy over decades would mathematically have an extremely low probability of remaining undiscovered. By contrast, smaller groups with shorter timelines present fewer opportunities for leaks or accidental disclosures.
This mathematical framework helps illustrate why complex and widespread conspiracies are inherently less likely. It provides a useful tool for critically assessing the validity of various claims, grounding discussions in logical and quantifiable terms rather than emotional or anecdotal arguments.
The Boonie Story
The high school is an imposing brick building with soaring white columns and a semi-circular drive enclosing an expansive lawn with tall shady oak trees. Go around to the back and you’ll find the sports field where Boonie led the boys’ soccer team.
One of Boonie’s responsibilities as team captain was to organize the fundraising car washes. The year this happened, Boonie decided to spice things up a bit by convincing the team to advertise the car wash by standing in the middle of the main street through town wearing only very skimpy shorts and sandals. Their “Car Wash” signs just barely covered the shorts. It’s not clear whether people were more offended by the lack of clothing or the fact they were actively blocking traffic. The school answering machine rapidly filled with angry messages.
Monday morning’s school announcements included one for Boonie to report to the principal’s office. Principal S. demanded Boonie apologize to the town by writing a letter to the editor, and so Boonie did as he was told. Here’s a lightly edited version:
Saturday the Boys Varsity Soccer had a car wash outside of the high school.
Unfortunately, what we thought was fun and games turned out to be very offensive.
Children of all ages saw us strutting around in our sports shorts; we didn’t consider the consequences of such immature humor.
Kids our age have been having high school car washes to support our teams, and what we thought was the norm turned out to be disastrous.
It went on from there and seemed to be an abject apology. But if you read the first letter of each sentence you’ll see the start of a hidden message which isn’t exactly apologetic.
Now, if Boonie had kept this to himself maybe nobody would have noticed. The printed version didn’t have the start of each sentence aligned below the previous one as I’ve done here. It would have been difficult to extract the hidden message. But what’s the fun in keeping something like this to yourself?
This is Boonie’s conundrum. As soon as he started telling his close friends, the word got around the school and everyone could read and decode the hidden message. And Boonie had signed his name to the letter.
Modeling the Spread of Rumors, Lies, and Innuendo
As soon as the rumor leaped across the nearly impenetrable student/parent information barrier, Roger and I sketched up a graph something like this on my whiteboard and began estimating how long Boonie had until he faced the wrath of Principal S. a second time.
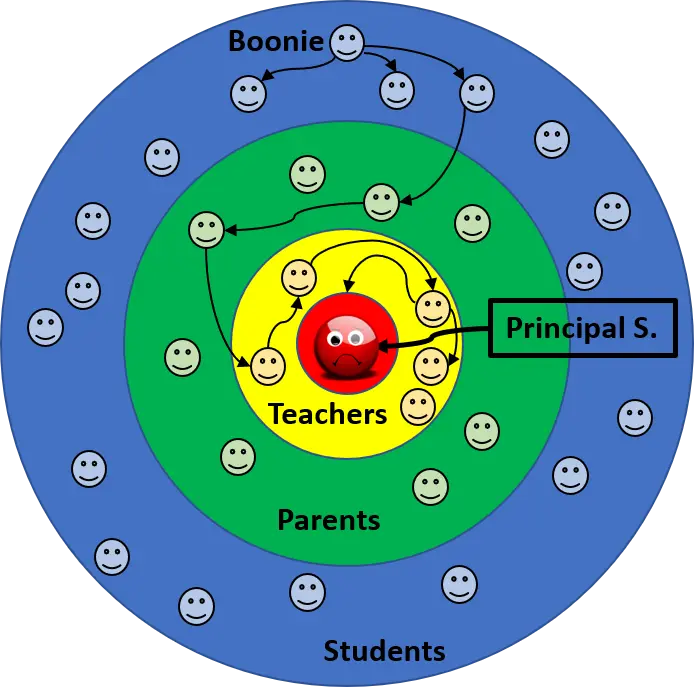
The path of the rumor from Boonie to friends, parents, teachers, and Principle S.
We figured he had about three weeks, and it turned out we were right to within a day or two.
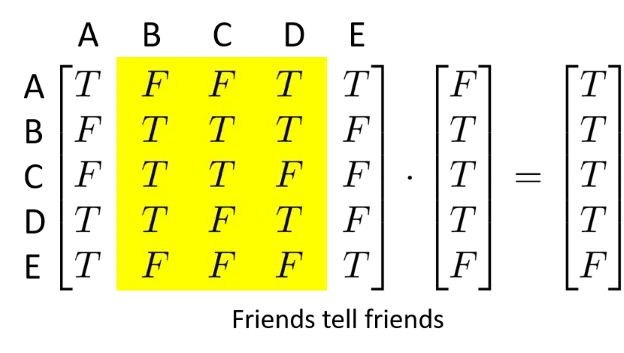
A simplified version might help explain this. Suppose there are five friends: Alex, Boonie, Channing, Drew, Ellison. A way to visualize this is through a matrix In mathematics, a matrix is a rectangular array of numbers. If a matrix has only one row or column it is called a vector, and matrices and vectors may be multiplied together as long as the number of columns in the matrix is the same as the number of rows in a vertical vector. Multiplication is done row by row where the first element of the row in the matrix is multiplied by the first element of the vector, and so on. The total is summed and generates the first element of the result. Continue through the remaining rows of the matrix to calculate the output vector. In the examples here, we use Boolean algebra for the multiplication, so , but if either element (or both) is false the result is false, . like this,

The friends matrix uses “T” (true) to indicate friendships between two people.
The row with a “C” in front (for Channing) has (true) in columns “Boonie” and “Channing”, but (false) for the others meaning Channing is friends with Boonie, but not Alex, Drew or Ellison. Next, we’ll add in a vector of people who know about the hidden message. In the beginning, only Boonie knows.
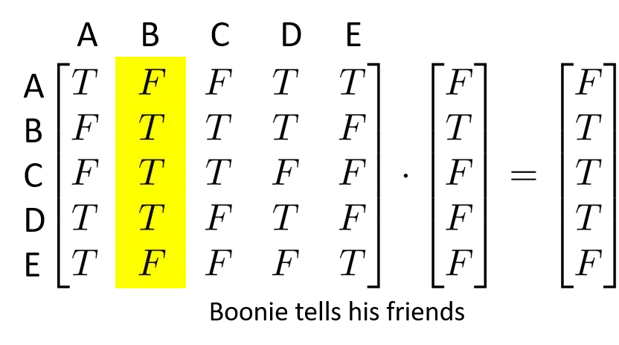
Boonie tells his friends. The matrix multiplication shows who knows - (B,C,D).
The highlighted column corresponds to the in the knowledge vector to the right of the Friends matrix and indicates everyone Boonie tells, in this case, Channing and Drew. You can multiply the Friends matrix by the rumor knowledge vector by taking the first entry in the vector and “multiplying” the entire first column of the friends. This makes everything for that column false, so put an in the first position of the output vector on the right after the equals sign. The next entry is because Boonie knows, and the column under “B” contains so those places where there’s a become in the output vector, but always remains . The remaining entries in the knowledge vector are so they don’t contribute anything.
Simulate the spread of the rumor from day to day by repeating this process. On the second day, Boonie, Channing, and Drew are all in on the rumor, so if any one of them tells someone else, that person knows. In other words, a single in the yellow highlighted region on the “A” row is sufficient for Alex to know. Drew knows and Drew is friends with Alex, so Alex hears about the story. The reason we put a in the Boonie row and column is it keeps Boonie in the know at each step. All of the entries on the diagonal are true for the same reason.
The rumor spreads as Boonie tells his friends, and they tell their friends.
Rumors don’t spread quite this quickly. We have motive, but not opportunity yet. Friends may get together during the school day, but there might be someone else (a teacher, Principal S.?) or another reason the message isn’t passed on. To simulate this, we’ll create an opportunity matrix the same size as the friends’ matrix with mostly ‘s but a few ‘s where the opportunity exists. The opportunity matrix changes randomly every day, simulating different interactions between students. Now if there is a in both the friends’ matrix and the opportunity matrix, the rumor expands.
We also need a way to transmit the message from students to parents to teachers to Principal S. A slight simplification is to remove the parents layer because there is about a one-to-one correspondence between students and parental units. That’s not quite true, but good enough for now.
Transmission from students to teachers is a matrix with the same number of rows as there are teachers, the number of columns corresponding to the number of students, and populated with ‘s and ‘s according to whether a student is a ratfink or not. Last, we’ll have a one row matrix (vector) which passes information from the faculty to Principal S. Most of the teachers can be considered ratfinks.
To recap, the simulation generates a random student Friends matrix, a Teacher friends matrix, and a Student-Teacher crossover matrix. The code generates rumor knowledge vectors for students and teachers, and a scalar for Principal S. They are all set to false except for the Boonie entry. Every day, the rumor spreads using the friends matrices and random opportunity matrices until it reaches Principal S. and Boonie gets a second trip to the office.
Experimental Results
To run the simulation we need estimates of the interactions between students, teachers, and Principal S. I used these:
- Number of students = 1500
- Number of teachers = 100
- Probability that a student is friends with another student = 0.5%. This works out to being friends with 7.5 other students, which might seem low at first, but it includes a factor for how comfortable one student is with telling someone else the story.
- Student opportunity = 1%. That is, there’s a 1% chance that during any given day he or she will run into a friend and have the opportunity to pass on the rumor.
- Student-teacher opportunity = 0.1%. There is a much lower probability that a student can pass it on to a teacher.
- Teacher friends = 5%. Out of 100 teachers, each one on average is sufficiently friendly with 5 others that they might discuss Boonie.
- Teacher opportunity = 0.1%. Teachers are busy, they don’t have time for these things.
- Teacher-principal opportunity = 1%. The principal is also busy.
With all that, this is a plot of a typical run. (Octave code boonieSim.m)
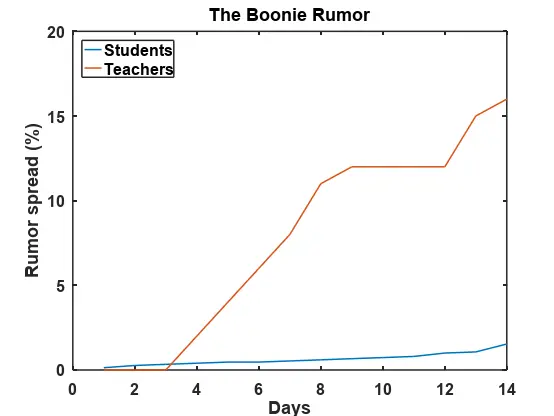
A single Monte Carlo simulation of the spread of the rumor.
In 14 school days, or almost three school weeks, the rumor travels from Boonie to Principal S. Only 16% of the teachers and 2% of the students (about 30) have heard the story, yet Boonie gets caught anyway.
If you’d like to recreate the simulation, download and install Octave, and then run the function boonieSim.
While working on the Manhattan Project, Stanislaw Ulam developed a method to study the motion and energy of atomic particles. It couldn’t give a precise answer but gave statistical approximations. By running a simple experiment on the ENIAC multiple times he was able to gain insight into the overall properties. Nicholas Metropolis suggested a secret code name for the process, “Monte Carlo” because of the random nature of the method, evoking the casinos of Monte Carlo.
We can perform Monte Carlo experiments with the Boonie rumor, too. Since the friends and opportunity matrices are generated randomly each time the function is called, the results will be slightly different at the end of each run. By repeating the experiment many times, we start to see patterns.
In this Monte Carlo experiment, I ran the same Boonie rumor function 1000 times. The peak seems to occur around 20 days, and the longest he got away with it is 80 days, but he always gets caught. In fact, after 40 days, there are fewer and fewer cases, meaning that Boonie is very unlikely to make it longer than 40 days in general. Monte Carlo experiments are useful for obtaining statistical insights into problems. You can also change the experiment by adjusting some of the parameters such as studentFriendship probability to see how sensitive the outcome is to a small change.
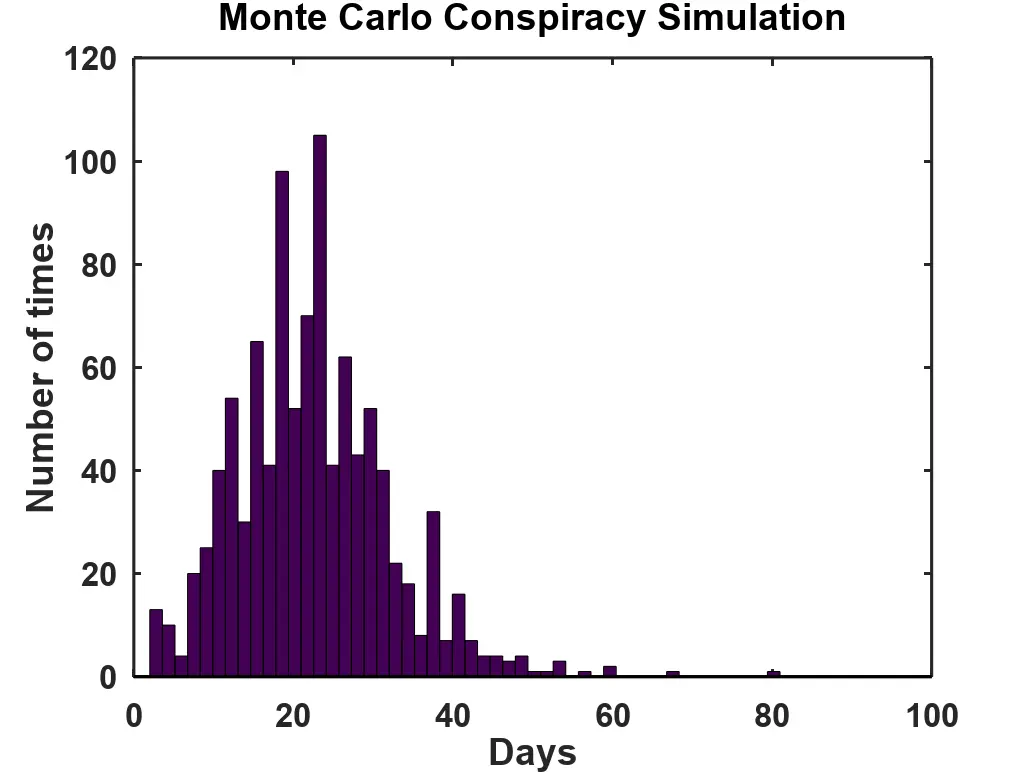
Results from 1000 Monte Carlo simulations showing the time until Boonie is caught.
On the Viability of Conspiratorial Beliefs
In this simulation Boonie always gets caught. But what about other conspiracies? Was the moon landing faked? Neil deGrasse Tyson says many people saw the Saturn V liftoff, plenty of documents and other evidence is still available, and there were thousands of people at NASA who designed the rocket and its subsystems. In the end, he says it would be easier to send astronauts to the moon than to try to maintain the silence of all those engineers.
David Grimes, from Oxford University, published a paper in PLOS ONE, On the Viability of Conspiratorial Beliefs in which he derived an equation for the survival time of a conspiracy theory. It depends on the number of conspirators, the amount of time since the beginning of the conspiracy, and an intrinsic probability of discovery common to all conspiracies. A faked moon landing would have been uncovered in about 3.7 years. His equation uses the Poisson statistics The Poisson distribution gives the probability of the number of events expected to occur in a fixed time interval. See The Wreck at Blossom and Sunset for an example application. to describe how the likelihood of a conspiracy theory spreading changes over time. Here, represents the number of people who believe in the theory at time .
where is the Gompertzian survival function,
represents the probability of leakage at time and is the Poisson distributed mean number of failures per unit time. The Gompertz function (video) has parameters for the initial number of conspirators, the average age of the conspirators at the time of the event, and empirically derived constants and which model how many conspirators take the mystery to their graves. The chance that the conspiracy outlives the conspirators declines rapidly with the number of people involved.
Exponential growth means that the number of believers can increase very rapidly. For example, if each believer convinces just one more person each day, the total number of believers can double quickly.
The Boonie Conundrum shows that while conspiracies do exist, eventually there’s a reckoning.
Code for this article
The Boonie Conundrum Simulation is Octave code for reproducing the Monte Carlo runs for the spread of the rumor.
Software
Conspiracy Theory Resources
With so many conspiracy theories running around on the internet we need a way to check and debunk stories. A good start is to Google it to see what comes up. For breaking news check multiple sources around the world (see List of news agencies). For in-depth analysis, scholarly articles are often good although they are sometimes locked behind paywalls.
The list below contains fact-checking organizations, and some articles on how to deal with conspiracy theories and people who believe them. But, even these should be taken with a grain of salt. Question everything!
- Snopes
- FactCheck
- PolitiFact
- Skeptical Inquirer
- RationalWiki
- Media Bias/Fact Check
- Ad Fontes Media
- The 8 Best Fact-Checking Sites for Finding Unbiased Truth (Repeats some listed above)
- Wikipedia article “Media bias in the United States”
- Wikipedia article “Conspiracy theory”
- List of fake news websites
- List of topics characterized as pseudoscience
- MIT Technology Review “How to talk to conspiracy theorists—and still be kind”
- Techniques of Science Denial
Abbie Richards created the Conspiracy Chart to test your level of belief in reality.
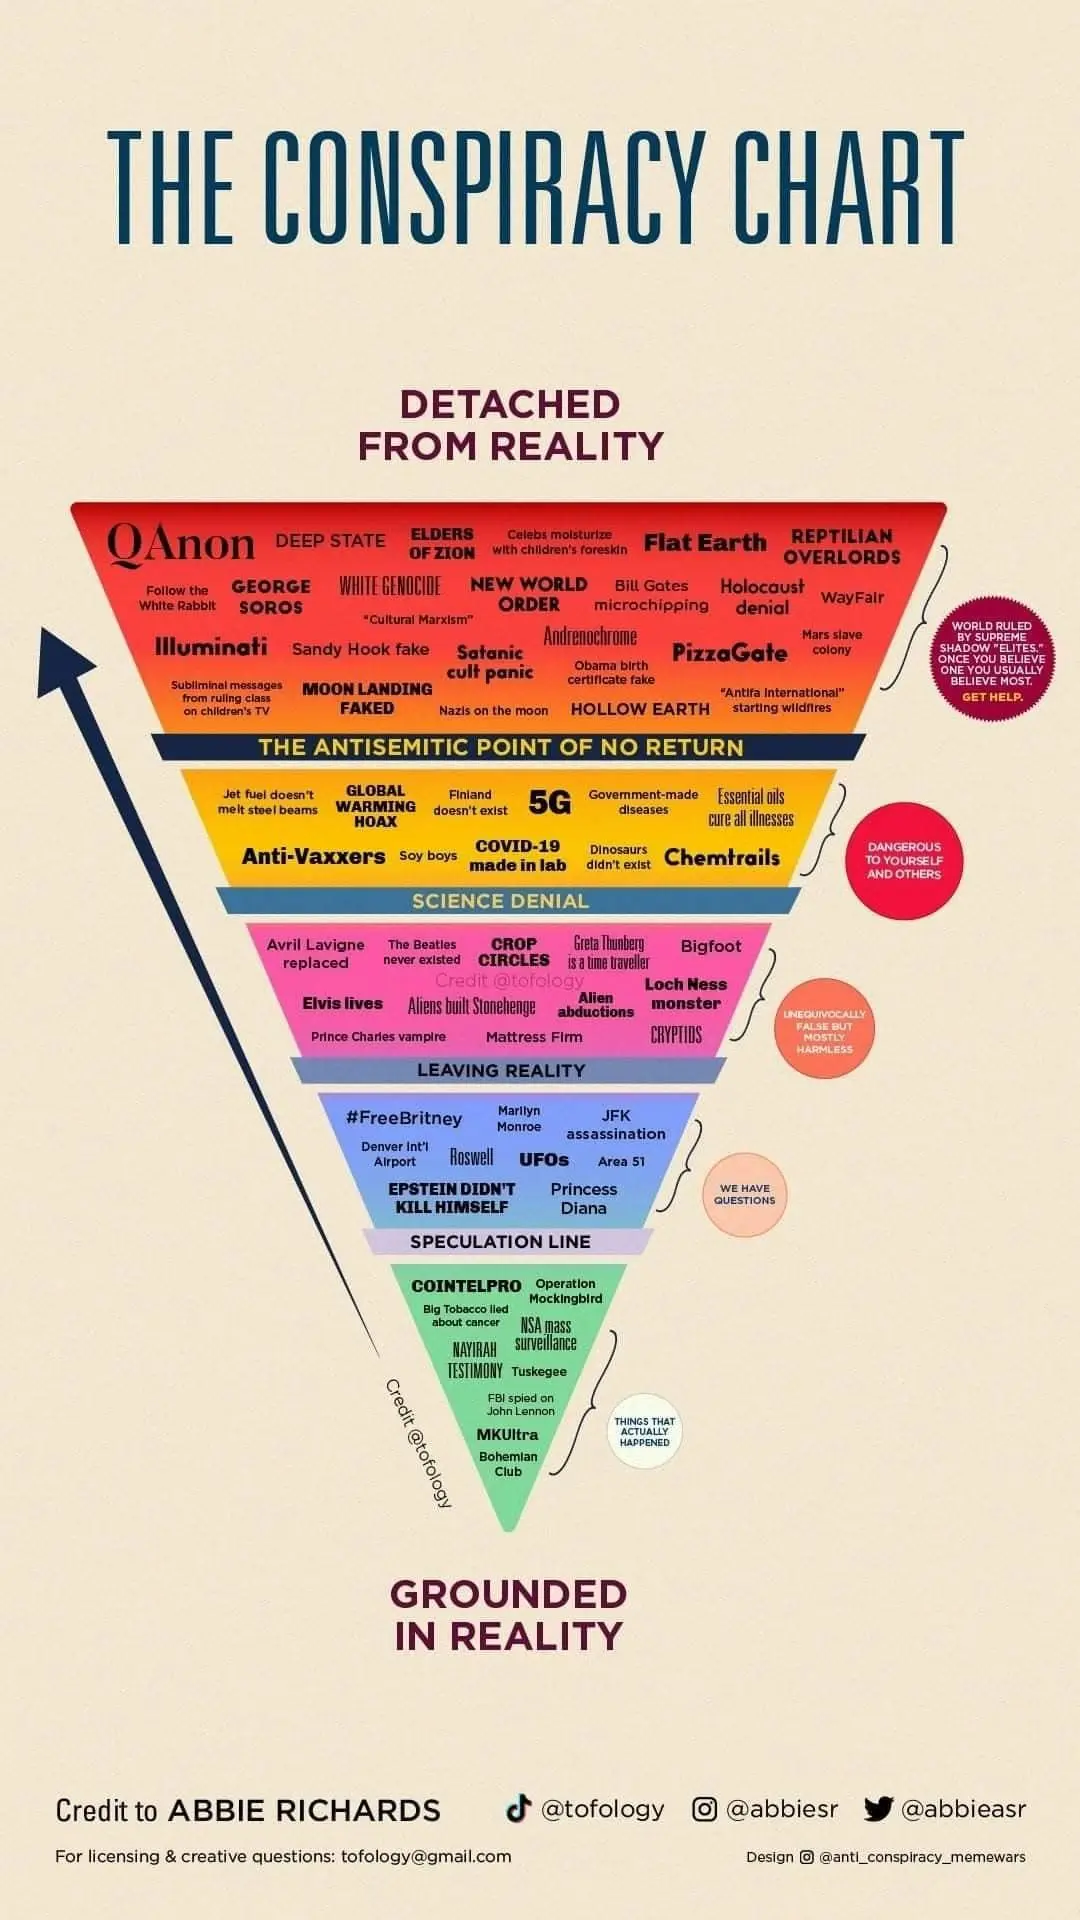
Abbie Richards’ conspiracy chart.
References and further reading
- S.-H. Ong, W.-J. Lee, and Y.-C. Low, “A general method of computing mixed Poisson probabilities by Monte Carlo sampling,” Mathematics and Computers in Simulation, vol. 170, pp. 98–106, Apr. 2020, doi: 10.1016/j.matcom.2019.09.003.
- J.-J. Cheng, Y. Liu, B. Shen, and W.-G. Yuan, “An epidemic model of rumor diffusion in online social networks,” Eur. Phys. J. B, vol. 86, no. 1, p. 29, Jan. 2013, doi: 10.1140/epjb/e2012-30483-5.
- F. Rigoli, “Deconstructing the Conspiratorial Mind: the Computational Logic Behind Conspiracy Theories,” Rev Philos Psychol, pp. 1–18, Aug. 2022, doi: 10.1007/s13164-022-00657-7.
- F. Rigoli, “Deconstructing the Conspiratorial Mind: the Computational Logic Behind Conspiracy Theories,” Rev.Phil.Psych., vol. 15, no. 2, pp. 567–584, June 2024, doi: 10.1007/s13164-022-00657-7.
- O. Sattarov and J. Choi, “Detection of Rumors and Their Sources in Social Networks: A Comprehensive Survey,” IEEE Trans. Big Data, vol. 11, no. 3, pp. 1528–1547, June 2025, doi: 10.1109/TBDATA.2024.3522801.
- “ENIAC,” Wikipedia. Sept. 25, 2025. Accessed: Sept. 30, 2025. [Online]. Available: https://en.wikipedia.org/w/index.php?title=ENIAC&oldid=1313249970
- S. Govindankutty and S. P. Gopalan, “Epidemic modeling for misinformation spread in digital networks through a social intelligence approach,” Sci Rep, vol. 14, no. 1, p. 19100, Aug. 2024, doi: 10.1038/s41598-024-69657-0.
- R. Pastor-Satorras, C. Castellano, P. V. Mieghem, and A. Vespignani, “Epidemic processes in complex networks,” Rev. Mod. Phys., vol. 87, no. 3, pp. 925–979, Aug. 2015, doi: 10.1103/RevModPhys.87.925.
- R. L. Harrison, “Introduction To Monte Carlo Simulation,” AIP Conf Proc, vol. 1204, pp. 17–21, Jan. 2010, doi: 10.1063/1.3295638.
- “MathGPT Video | Explaining the Gompertz survival function, its mathematical formulation, and its applications in modeling population growth, particularly in biology a.” Accessed: Sept. 30, 2025. [Online]. Available: https://math-gpt.org/video/abebac4c-b431-4a6d-82dc-4014bd44da36
- “Maths study shows conspiracies ‘prone to unravelling,’” BBC News, Jan. 26, 2016. Accessed: Sept. 30, 2025. [Online]. Available: https://www.bbc.com/news/science-environment-35411684
- “Monte Carlo method,” Wikipedia. Sept. 26, 2025. Accessed: Sept. 30, 2025. [Online]. Available: https://en.wikipedia.org/w/index.php?title=Monte_Carlo_method&oldid=1313510077
- “Nicholas Metropolis,” Wikipedia. Aug. 27, 2025. Accessed: Sept. 30, 2025. [Online]. Available: https://en.wikipedia.org/w/index.php?title=Nicholas_Metropolis&oldid=1308008150
- D. R. Grimes, “On the Viability of Conspiratorial Beliefs,” PLoS ONE, vol. 11, no. 1, p. e0147905, Jan. 2016, doi: 10.1371/journal.pone.0147905.
- “Rumor spread in social network,” Wikipedia. Sept. 15, 2025. Accessed: Sept. 30, 2025. [Online]. Available: https://en.wikipedia.org/w/index.php?title=Rumor_spread_in_social_network&oldid=1311584039
- X. Chen and N. Wang, “Rumor spreading model considering rumor credibility, correlation and crowd classification based on personality,” Sci Rep, vol. 10, no. 1, p. 5887, Apr. 2020, doi: 10.1038/s41598-020-62585-9.
- W. Liu, J. Wang, and Y. Ouyang, “Rumor Transmission in Online Social Networks Under Nash Equilibrium of a Psychological Decision Game,” Netw Spat Econ, vol. 22, no. 4, pp. 831–854, Dec. 2022, doi: 10.1007/s11067-022-09574-9.
- H. Hui, C. Zhou, X. Lü, and J. Li, “Spread mechanism and control strategy of social network rumors under the influence of COVID-19,” Nonlinear Dyn, vol. 101, no. 3, pp. 1933–1949, Aug. 2020, doi: 10.1007/s11071-020-05842-w.
- “Stanisław Ulam,” Wikipedia. Sept. 29, 2025. Accessed: Sept. 30, 2025. [Online]. Available: https://en.wikipedia.org/w/index.php?title=Stanis%C5%82aw_Ulam&oldid=1314093842
- S. Vosoughi, D. Roy, and S. Aral, “The spread of true and false news online,” Science, vol. 359, no. 6380, pp. 1146–1151, Mar. 2018, doi: 10.1126/science.aap9559.
Image credits
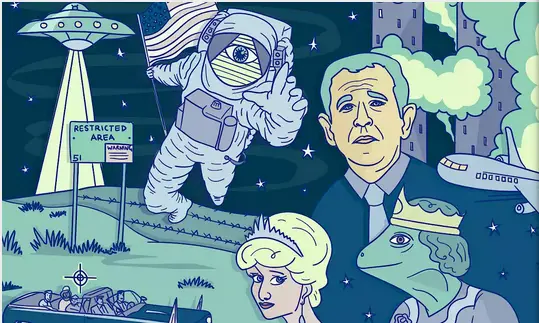
- Hero: Atze Lourens, “What do religion, populism and conspiracies have in common?” Medium
- The Conspiracy Chart: Abbie Richards 2021